|
| Adam Carr's Election Archive
|
Australian federal election, 2022
Division of Watson, New South Wales
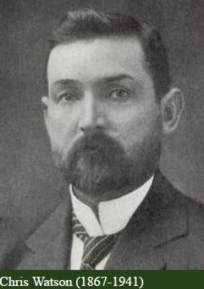
Named for: Hon Chris Watson (1867-1941), NSW MP 1894-1901,
federal MP 1901-10, Prime Minister 1904 (first Labor Prime Minister)
Inner western Sydney: Ashbury, Campsie, Greenacre, Lakemba, Punchbowl
State seats: Parts of
Auburn,
Bankstown,
Canterbury,
East Hills,
Lakemba,
Strathfield and
Summer Hill
Local government areas: Parts of
Burwood,
Canterbury-Bankstown,
Cumberland,
Inner West and
Strathfield
Borders with:
Banks,
Barton,
Blaxland,
Grayndler and
Reid
Enrolment at 2019 election: 107,810
Enrolment at 2022 election: 108,806 (+00.9)
1999 republic referendum: Yes 54.4
2018 same-sex marriage survey: No 69.6
Sitting member: Hon Tony Burke (Labor):
Elected 2004, 2007, 2010, 2013, 2016, 2019
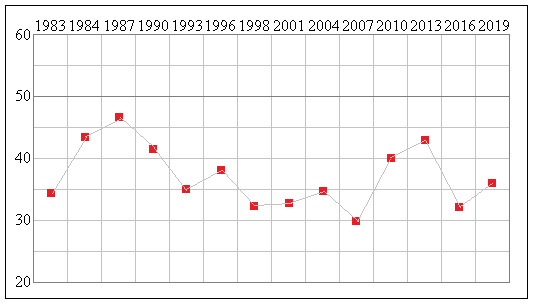
2007 Labor majority over Liberal: 20.3%
2010 Labor majority over Liberal: 9.1%
2013 Labor majority over Liberal: 6.8%
2016 Labor majority over Liberal: 17.6%
2019 Labor majority over Liberal: 13.5%
Liberal two-party vote 1983-2019
Status: Safe Labor
Best Labor booths, two-party vote: Lakemba North (82.9), Wiley Park East (81.5), Wiley Park West (77.2),
Lakemba (75.9), Bankstown (73.9)
Best Liberal booths, two-party vote: Bellfield (52.0), Croydon (51.7), Enfield West (46.9),
Enfield South (46.8), Croydon Park (43.9)
2019 results
Statistics and history
Candidates in ballot-paper order:
 |
 |
 |
 |
 |
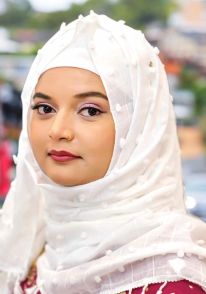
1. Sazeda Akter
Liberal Party |
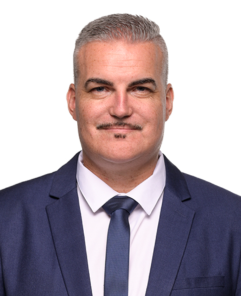
2. John Koukoulis
United Australia Party |
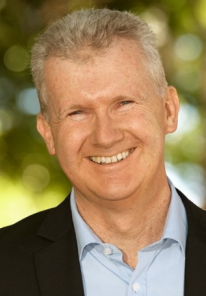
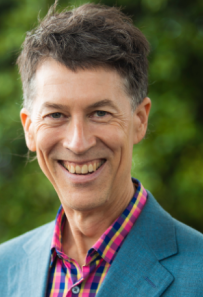
3. Hon Tony Burke
Australian Labor Party |
4. Alan Jorgensen
Pauline Hanson's One Nation |
5. Bradley Schott
Australian Greens |
Candidate websites:
Sazeda Akter
Hon Tony Burke
John Koukoulis
Bradley Schott
Division of Watson
Watson was created in 1993, when the old seat of
St George was renamed. (There was an earlier seat of
Watson from 1934 to
1969, orginally Prime Minister
Chris Watson's seat of
South Sydney, in much the same area.) It was initially based in
Sydney's inner southern suburbs, a heavily working-class and multi-cultural area, and the centre of Sydney's large and
 growing Muslim community. The seat has one of the highest proportion of people born in non English speaking countries
of any electorate. It has the second-highest proportion of Muslims of any seat (after Blaxland). This explains Watson's No
vote on marriage equality.
The 2007 and 2010 redistributions moved Watson to the north and west, so that it shed some of its working-class
territory and gained more middle-class areas in Ashfield, Burwood and Strathfield. As a result, the Labor two-party
vote fell from 20.3% in 2007 to 6.8% in 2013. The 2016 redistribution partly reversed this, removing parts of
Strathfield and Burwood and adding some Labor territory in Canterbury and Punchbowl, and increasing the Labor
margin.
Members for St George included
Bill Morrison, a minister in the Whitlam Government. Members for Watson have been
Leo McLeay, a legendary powerbroker in the right-wing faction of the NSW Labor Party, and Tony Burke, who succeeded
him in 2004.
Tony Burke, Labor MP Burke since 2004, was an organiser with the Shop Distributive and Allied Employees Association
before being elected to the NSW Legislative Council in 2003. He went straight onto the opposition front bench in 2004
and was a senior minister throughout the Rudd-Gillard Government. He is now Shadow Minister for the Arts and Shadow Minister
for Industrial Relations. The Greens candidate is Bredley Schott, an interior designer.
Demographics:
Median weekly household income: $1,281 (Australia $1,438)
People over 65: 12.9% (Australia 15.8%)
Australian born: 44.4% (Australia 66.7%)
Ancestry: Lebanese 13.2%, Chinese 11.3%, Greek 5.3
Non-English-speaking households: 69.9% (Australia 22.2%)
Muslim 23.4%, Orthodox Christian 8.1%
Catholics 23.4% (Australia 22.6%)
No religion 15.6% (Australia 29.6%)
University graduates: 22.9% (Australia 22.0%)
Professional and managerial employment: 29.6% (Australia 35.2%)
Employed in manufacturing and construction: 21.2% (Australia 22.9%)
Paying a mortgage: 28.2% (Australia 34.5%)
Renting: 39.4% (Australia 30.9%)
Traditional families: 43.1% (Australia 32.8%)
Back to main page
|
 growing Muslim community. The seat has one of the highest proportion of people born in non English speaking countries
of any electorate. It has the second-highest proportion of Muslims of any seat (after Blaxland). This explains Watson's No
vote on marriage equality.


