|
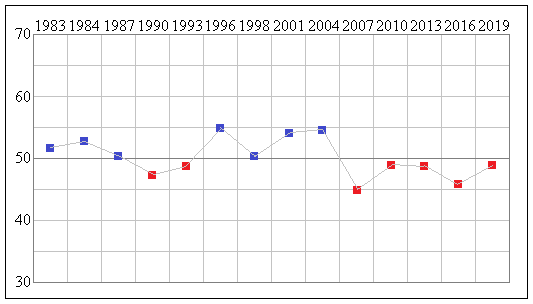


Moreton has existed since Federation, although its boundaries have varied greatly over that time - it was
orginally based on Ipswich. Since 1949 it has been a southern Brisbane suburban seat, initially safe for the
Liberal Party but growing more marginal as these areas declined in socio-economic terms and grew more
multicultural. Although it has a relatively high level of median family income, a significant sign of social change
is that it has Queensland's highest proportion of non English speaking households, mainly due to an influx of Chinese
immigrants. This suggests that the seat is becoming an inner city multuicultural seat rather than a suburban mortgage belt
seat.
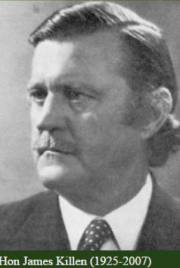 Members for Moreton have included long-serving conservative ministers
Sir Josiah Francis and
Sir James Killen.
Garrie Gibson, the first Labor member for Moreton since 1906, was defeated in the Howard landslide of 1996. His
successor,
Gary Hardgrave, was a junior minister in the Howard Government, but was defeated in the Rudd sweep of
Queensland seats in 2007.
Members for Moreton have included long-serving conservative ministers
Sir Josiah Francis and
Sir James Killen.
Garrie Gibson, the first Labor member for Moreton since 1906, was defeated in the Howard landslide of 1996. His
successor,
Gary Hardgrave, was a junior minister in the Howard Government, but was defeated in the Rudd sweep of
Queensland seats in 2007.
Graham Perrett, MP for Moreton since 2007, was a teacher and an organiser with the Queensland Independent Education
Union before his election. He was narrowly re-elected in 2010 and 2013. This is a still a marginal seat,
Perrett gained a modest swing towards him in 2016, but this was reversed in 2019 and the seat is again highly marginal.
He is currently Shadow Assistant Minister for Education. The Liberal candidate is Steven Huang, a Brisbane City Councillor.
The Greens candidate is Claire Garton, an information technology professional.
* The difference in spelling arises from an error in the published version of Cook's journal. The title
Earl of Morton derives from Morton Castle in Dumfriesshire, Scotland.
Demographics:
Median weekly household income: $1,601 (Australia $1,438)
People over 65: 12.8% (Australia 15.8%)
Australian born: 54.4% (Australia 66.7%)
Ancestry: Chinese 12.2%
Non-English-speaking households: 36.7% (Australia 22.2%)
Catholics 18.4% (Australia 22.6%)
No religion 32.7% (Australia 29.6%)
University graduates: 33.5% (Australia 22.0%)
Professional and managerial employment: 40.2% (Australia 35.2%)
Employed in manufacturing and construction: 17.9% (Australia 22.9%)
Paying a mortgage: 32.6% (Australia 34.5%)
Renting: 34.0% (Australia 30.9%)
Traditional families: 35.1% (Australia 32.8%)

Gallery of Members for Moreton
Boundaries following most recent redistribution:
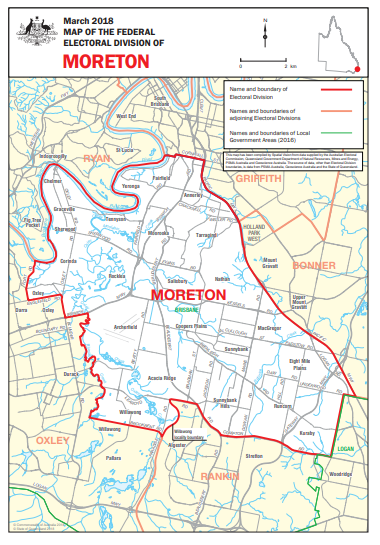
See full-size map of this Division
Demographics:
Median weekly household income: $1,601 (Australia $1,438)
People over 65: 12.8% (Australia 15.8%)
Australian born: 54.4% (Australia 66.7%)
Ancestry: Chinese 12.2%
Non-English-speaking households: 36.7% (Australia 22.2%)
Catholics 18.4% (Australia 22.6%)
No religion 32.7% (Australia 29.6%)
University graduates: 33.5% (Australia 22.0%)
Professional and managerial employment: 40.2% (Australia 35.2%)
Employed in manufacturing and construction: 17.9% (Australia 22.9%)
Paying a mortgage: 32.6% (Australia 34.5%)
Renting: 34.0% (Australia 30.9%)
Traditional families: 35.1% (Australia 32.8%)
Gallery of Members for Moreton
Boundaries following most recent redistribution:
See full-size map of this Division
People over 65: 12.8% (Australia 15.8%)
Australian born: 54.4% (Australia 66.7%)
Ancestry: Chinese 12.2%
Non-English-speaking households: 36.7% (Australia 22.2%)
Catholics 18.4% (Australia 22.6%)
No religion 32.7% (Australia 29.6%)
University graduates: 33.5% (Australia 22.0%)
Professional and managerial employment: 40.2% (Australia 35.2%)
Employed in manufacturing and construction: 17.9% (Australia 22.9%)
Paying a mortgage: 32.6% (Australia 34.5%)
Renting: 34.0% (Australia 30.9%)
Traditional families: 35.1% (Australia 32.8%)