|
|
|
|
| Adam Carr's Election Archive
|
Australian federal election, 2022
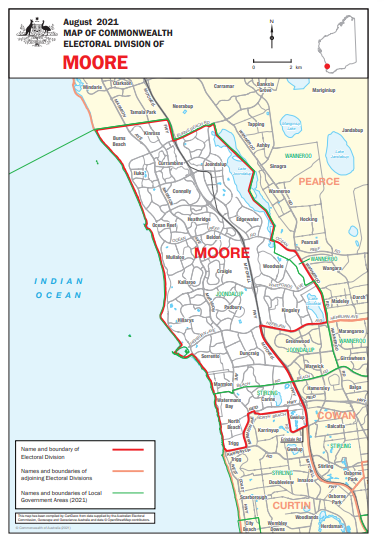
Division of Moore, Western Australia
Named for: Moore River (from George Moore (1798-1886), first WA
Advocate-General). The river is no longer in the Divison.
Northern Perth: Burns Beach, Carine, Hillarys, Joondalup, Kingsley
State seats: All of
Hillarys and
Joondalup, parts of
Burns Beach,
Carine,
Kingsley and
Scarborough
Local government areas: Parts of
Joondalup and
Stirling
Borders with:
Cowan,
Curtin and
Pearce
Enrolment at 2019 election: 101,524
Enrolment at 2022 election: 119,412 (+17.6)
1999 republic referendum: No 57.4
2018 same-sex marriage survey: Yes 68.0
Sitting member: Ian Goodenough (Liberal):
Elected 2013, 2016, 2019
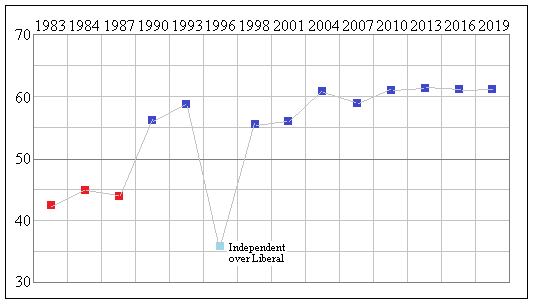
2007 Liberal majority over Labor: 9.2%
2010 Liberal majority over Labor: 11.2%
2013 Liberal majority over Labor: 11.9%
2016 Liberal majority over Labor: 11.0%
2019 Liberal majority over Labor: 11.7%
2019 notional Liberal majority over Labor: 11.6%
Liberal two-party vote 1983-2019
Status: Fairly safe Liberal
Best Liberal booths, two-party vote: Sorrento Beach (76.9), Hillarys West (75.4), Hillarys North (71.8),
Burns Beach (69.5), Gwelup (69.1)
Best Labor booths, two-party vote: Joondalup Central (52.7), Craigie (52.5), Heathridge East (52.3), Beldon (52.2),
Edgewater (46.9)
2019 results
Statistics and history
Candidates in ballot-paper order:
 |
 |
 |
 |
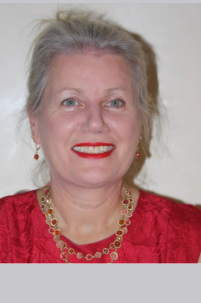
1. Sue Anderson
Great Australian Party |
2. Peter Gunness
Western Australia Party |
3. Tom French
Australian Labor Party |
4. Mark Cooper
Australian Greens |
 |
 |
 |
|
5. Ian Goodenough
Liberal Party |
6. Brian Brightman
Pauline Hanson's One Nation |
7. Helen Watkinson
United Australia Party |
8. Martin Suter
Australian Federation Party |
Candidate websites:
Sue Anderson
Mark Cooper
Tom French
Ian Goodenough
Peter Gunness
Martin Suter
Helen Watkinson
Division of Moore
Moore was created in 1949, as a rural seat occupying the northern half of the Wheat Belt. On these boundaries it was a
safe non-Labor seat, changing hands between the Liberal and Country parties. In 1980 it was changed into a part-rural,
part-suburban seat on the northern fringes of Perth, and became politically marginal. In 1990 it was changed again
into a suburban seat, along the northern beachside suburbs of Perth. It is now a classic mortgage belt seat, with
high levels of families with dependent children and wellings being purchased, though it is more affluent than most
seats of this type. It also has the highest proportion of people born in the UK of any seat: one-fifth of the voters
are British-born. All these factors make Moore a fairly safe Liberal seat on the current boundaries.
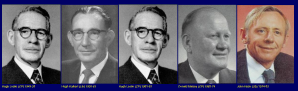
Dr Malcolm Washer won Moore for the Liberals in 1998, defeating
Paul Filing, the former Liberal member who had lost
his Liberal preselection in 1996 but retained the seat as an independent. Washer spent 15 years on the backbench,
but became a respected figure and a dissident on some issues. He retired in 2013.
Ian Goodenough, Liberal MP for Moore since 2013, is an accountant and was a company director before his election.
He was also a member of Wanneroo City Council. He was born in Singpore of Chinese and English ancestry. Local Liberals
tried to dump him in 2018 but he was saved by prime ministerial intervention.
The 2021 redistribution has extended the seat to the south, into territory which was formerly in the
abolished seat of
Stirling,
slightly reducing the Liberal majority. The Labor candidate is Tom French, an electrician. The Greens candidate in
Mark Cooper, a postgraduate student.
The state seats in this area produced huge swings to Labor at the 2021 state election. This was
entirely due to state issues and should not be taken as an indicator that similar results
can be expected in WA at a federal election.
Demographics:
Median weekly household income: $2,002 (Australia $1,438)
People over 65: 13.5% (Australia 15.8%)
Australian born: 57.2% (Australia 66.7%)
Non-English-speaking households: 14.4% (Australia 22.2%)
Catholics 23.1% (Australia 22.6%)
No religion 32.9% (Australia 29.6%)
University graduates: 23.7% (Australia 22.0%)
Professional and managerial employment: 36.4% (Australia 35.2%)
Employed in manufacturing and construction: 26.1% (Australia 22.9%)
Paying a mortgage: 46.6% (Australia 34.5%)
Renting: 17.4% (Australia 30.9%)
Traditional families: 42.1% (Australia 32.8%)
Back to main page
|
|