|
|
|
|
| Adam Carr's Election Archive
|
Australian federal election, 2019
Division of Flynn, Queensland
Central Queensland coast: Biloela, Gayndah, Gladstone, Gracemere, Mount Morgan
State seats: All of
Gladstone, parts of
Burnett,
Callide,
Gregory,
Mirani and
Rockhampton
Local government areas: All of Banana, Central Highlands, Gladstone, North Burnett and Woorabinda,
parts of Bundaberg, South Burnett and Rockhampton
Enrolment at close of rolls: 103,056
2018 same-sex marriage survey: Yes 51.5
Sitting member: Ken O'Dowd (Nationals):
Elected 2010, 2013, 2016
2007 Labor majority over Nationals: 0.2%
2010 Nationals majority over Labor: 3.6%
2013 Nationals majority over Labor: 6.5%
2016 Nationals majority over Labor: 1.0%
2019 notional Nationals majority over Labor: 1.0%
Status: Very marginal Nationals
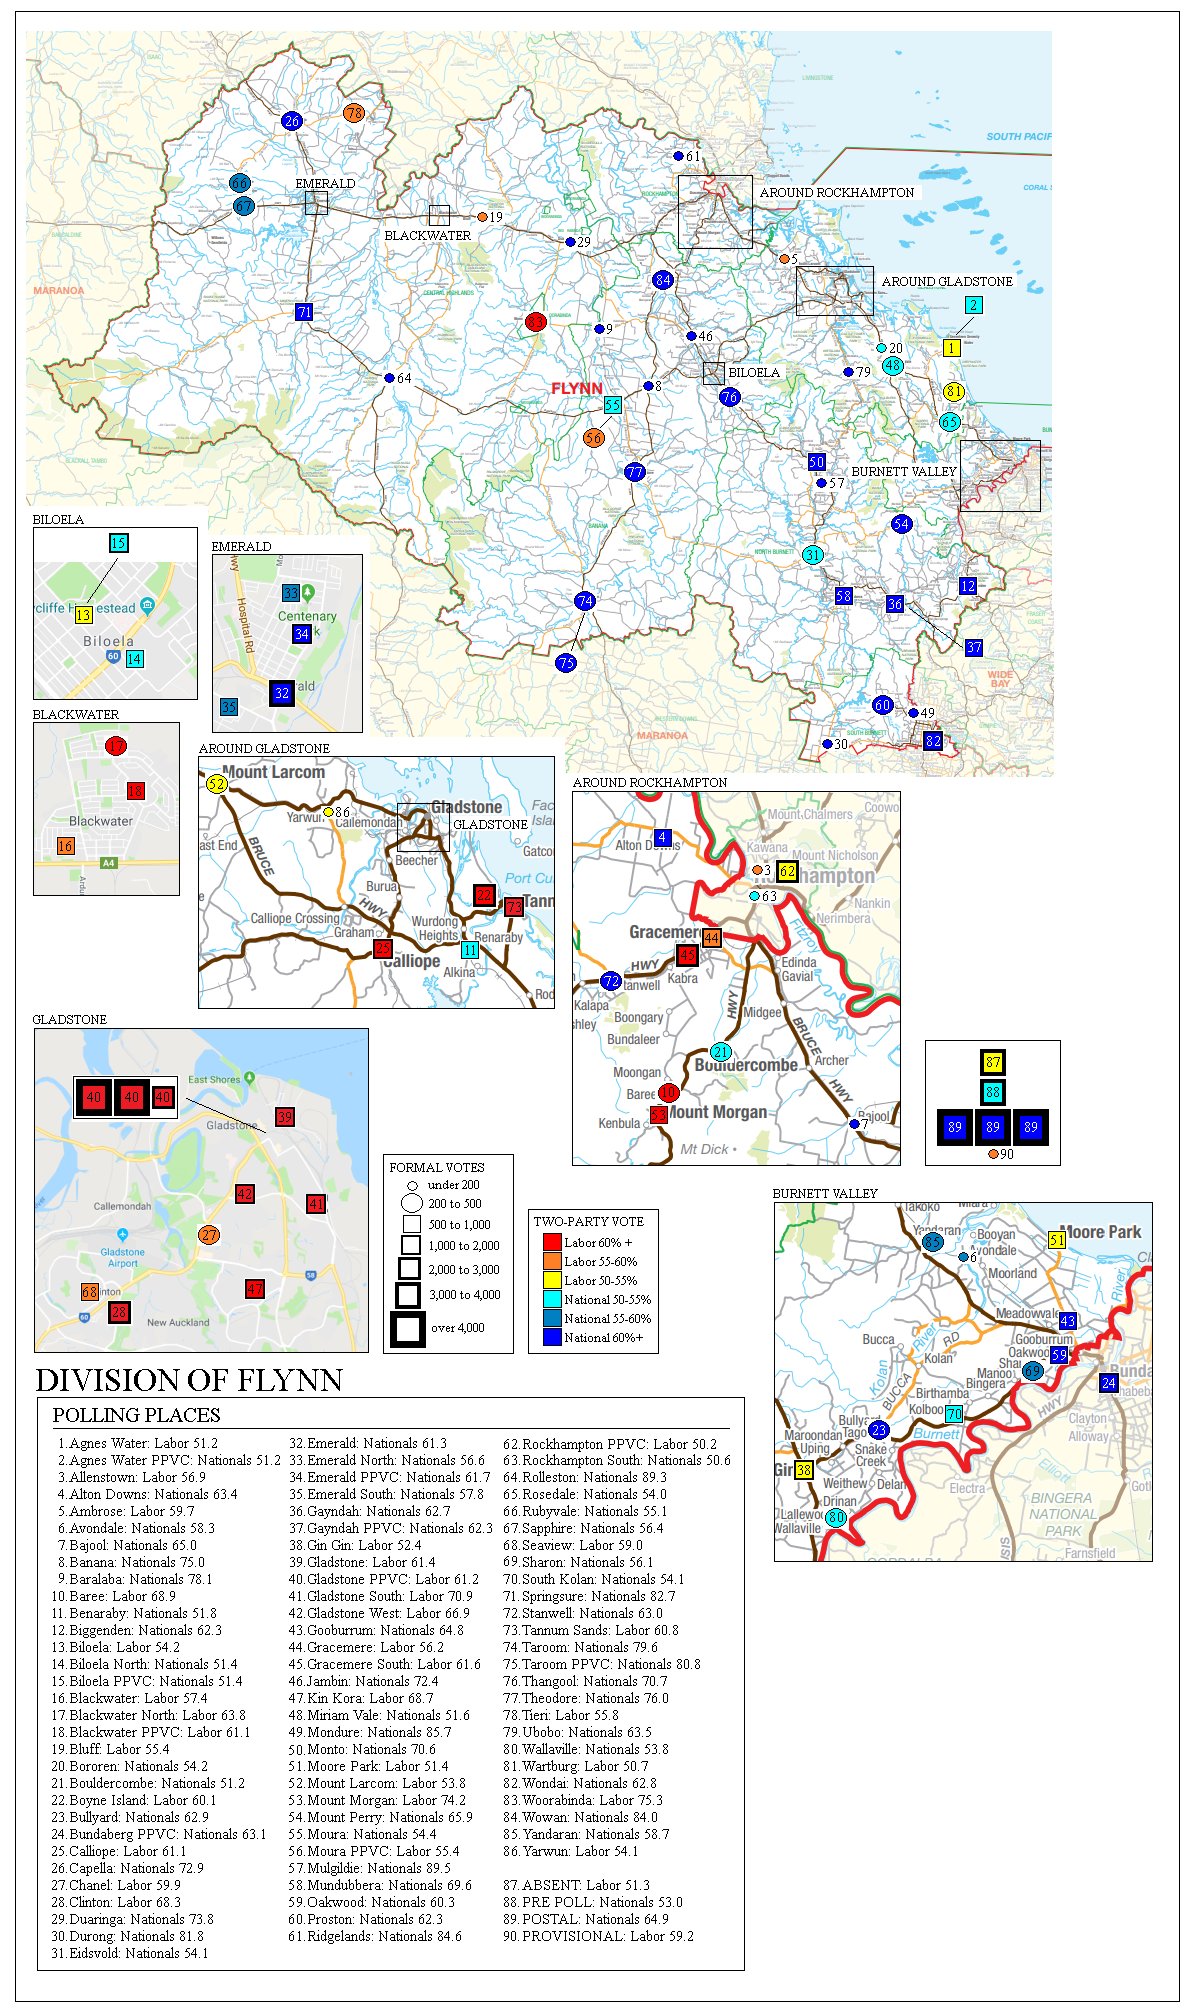
Best Nationals booths, two-party vote: Mulgildie (89.5), Rolleston (89.3), Mondure (85.7), Ridgelands (84.6),
Durong (81.8)
Best Labor booths, two-party vote: Woorabinda (75.3), Mount Morgan (74.2), Gladstone South (70.9), Baree (68.9),
Kin Kora (68.7)
2016 results
Statistics and history
Candidates in ballot-paper order:
 |
 |
 |
 |
 |
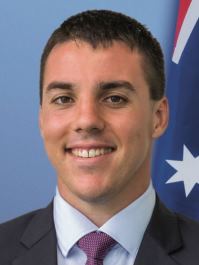
1. Zac Beers
Australian Labor Party |
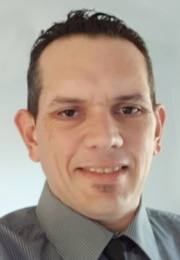
2. Nathan Harris
United Australia Party |
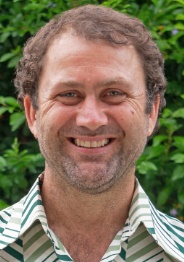
3. Jaiben Baker
Australian Greens |
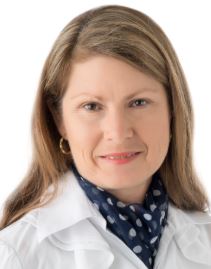
4. Murray Petersen
Independent |
5. Sharon Lohse
Pauline Hanson's One Nation |
 |
 |
 |
6. Duncan Scott
Independent |
7. Marcus Hiesler
Fraser Anning's Conservative
National Party |
8. Ken O'Dowd
The Nationals |
Candidate websites:
Jaiben Baker
Zac Beers
Sharon Lohse
Ken O'Dowd
Division of Flynn
Flynn was created by the 2006 redistribution, from parts of the old seats of Capricornia, Hinkler, Maranoa and Wide Bay. Its largest centre is the
industrial and mining port of Gladtone, and it runs inland through rural centres such as Monto and Eidsvold to the mining towns of Emerald
and Blackwater. It also includes the rural Burnett Valley and some Rockhmapton suburbs. Flynn has the usual rural mix of low median family incomes,
a low level of people in professional and managerial occupations and a low proportion of non English speaking households. Over 12% workforce is
employed in agriculture.
The the Gladstone-Mount Morgan area is a Labor stronghold: even in 2013, Labor won every booth in by a wide margin. Outside Gladstone, however,
Labor's only stronge areas are Blackwater and the Indigenous shire of Woorabinda. The rural parts of the seat vote overwhelming for the
Nationals.
Labor's win in Flynn in 2007 was one of the upsets of the election, and the recovery of the seat by the Nationals in 2010 was no surprise. The
Nationals increased their majority in 2013, but in 2016 Labor gained a solid 5.5% swing.
Ken O'Dowd, Nationals MP for Flynn since 2010, was a timber and hardware merchant before his election. He is one of the Parliament's more
inconspicuous backbenchers. Since he was already 60 when he was elected, he is unlikely to change that status.
The Labor candidate, in a sharp contrast, is a 28-year-old organiser with the Australian Workers Union, Zac Beers, who also ran in 2016.
Given Labor's strong recent polling in Queensland, this will be a front-line marginal at the 2019 election. The Greens candidate is Jaiben Baker,
a farmer. One Nation's candidate is Sharon Lohse, a beef farmer from Biggenden.
Demographics:
Median weekly household income: $1,384 (Australia $1,438)
People over 65: 13.0% (Australia 15.8%)
Indigenous: 5.3% (Australia 2.8%)
Australian born: 79.0% (Australia 66.7%)
Ancestry: German 5.4%
Non-English-speaking households: 5.9% (Australia 22.2%)
Catholics 21.6% (Australia 22.6%)
No religion 24.6% (Australia 29.6%)
University graduates: 9.7% (Australia 22.0%)
Professional and managerial employment: 25.4% (Australia 35.2%)
Employed in manufacturing and construction: 24.1% (Australia 22.9%)
Employed in agriculture: 12.4% (Australia 3.3%)
Paying a mortgage: 33.2% (Australia 34.5%)
Renting: 33.8% (Australia 30.9%)
Traditional families: 32.5% (Australia 32.8%)
Members:
Chris Trevor (ALP) 2007-10
Ken O'Dowd (Nat) 2010-
Boundaries following 2018 redistribution:
Back to main page
|
|