|
|
|
|
| Adam Carr's Election Archive
|
Australian federal election, 2022
Division of Newcastle, New South Wales
Named for: City of Newcastle (named in 1804 by Governor Hunter, after Newcastle-upon-Tyne, Britain:
also a coal port)
North Central New South Wales: Adamstown, Newcastle, Wallsend, Waratah
State seats: Parts of
Charlestown,
Newcastle and
Wallsend
Local government areas: Parts of
Lake Macquarie and
Newcastle
Borders with:
Hunter,
Paterson and
Shortland
Enrolment at 2019 election: 117,746
Enrolment at 2022 election: 122,587 (+04.1)
1999 republic referendum: Yes 51.0
2018 same-sex marriage survey: Yes 74.8
Sitting member: Sharon Claydon (Labor):
Elected 2013, 2016, 2019
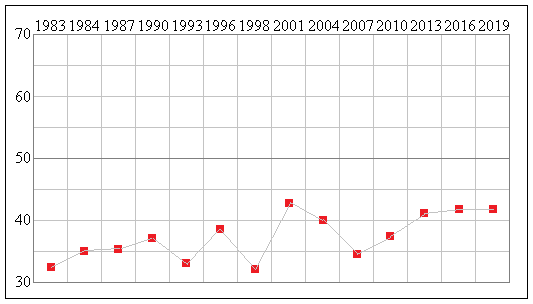
2007 Labor majority over Liberal: 15.9%
2010 Labor majority over Liberal: 12.5%
2013 Labor majority over Liberal: 8.8%
2016 Labor majority over Liberal: 13.8%
2019 Labor majority over Liberal: 13.8%
Liberal two-party vote 1983-2019
Status: Safe Labor
Best Labor booths, two-party vote: Tighes hill (79.3), Islington (79.1), Jesmond North (76.7), Waratah West (75.2),
Mayfield South (74.8)
Best Liberal booths, two-party vote: Merewether Heights (51.9), Merewether South (51.5), Cardiff Heights (48.1),
Charlestown PPVC (45.7), Hamilton South (45.4)
2019 results
Statistics and history
Candidates in ballot-paper order:
 |
 |
 |
 |
1. Garth Pywell
Australian Federation Party |
2. Charlotte McCabe
Australian Greens |
3. Amanda Cook
United Australia Party |
4. Sharon Claydon
Australian Labor Party |
 |
 |
 |
 |
5. Bill Hussey
Informed Medical Options |
6. Katrina Wark
Liberal Party |
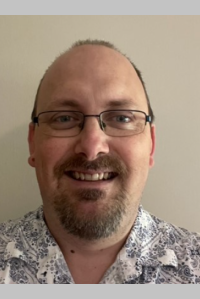
7. Mark Watson
Pauline Hanson's One Nation |
8. Emily Brollo
Animal Justice Party |
Candidate websites:
Emily Brollo
Sharon Claydon
Amanda Cook
Bill Hussey
Charlotte McCabe
Garth Pywell
Katrina Wark
Mark Watson
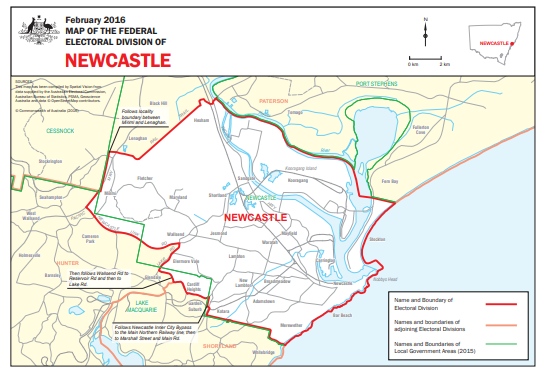
Division of Newcastle
Newcastle has existed since Federation, and has always been based on the Hunter Valley port of the same name.
Newcastle was once Australia's premier coal-export port and steel-making city, but today it has become a regional
hub for government, health and education services, with a lower-than-average level of people working in manufacturing and construction,
and above-average levels of university graduates and people in professional and managerial employment. It also one of the most
monocultural Labor-held seats, having no significant ethhic or religious minorities.
Despite these changes (and to some extent because of them), Newcastle has always been safe for Labor and remains so today.
It has the distinction of being the only federal electorate to have been held by the same political party for
the entire 120 years since the first federal election: in that time it has had only six members, all Labor. Yet only one Labor member for
Newcastle has been a minister,
Charles Jones in the Whitlam Government. For the 30 years after his retirement
Newcastle was held by two inconspicuous backbenchers,
Allan Morris and
Sharon Grierson. Grierson retired in 2013.
Sharon Claydon, Labor MP for Newcastle since 2013, was a disability support worker and social anthropologist
before her election. She was also a member of Newcastle City Council. The Liberal candidate is Katrina Wark, a
Newcastle City Councillor. The Greens candidate is Charlotte McCabe, a teacher.
Demographics:
Median weekly household income: $1,398 (Australia $1,438)
People over 65: 15.5% (Australia 15.8%)
Indigenous: 3.4% (Australia 2.8%)
Australian born: 81.3% (Australia 66.7%)
Non-English-speaking households: 11.8% (Australia 22.2%)
Catholics 22.2% (Australia 22.6%)
No religion 33.2% (Australia 29.6%)
University graduates: 24.3% (Australia 22.0%)
Professional and managerial employment: 38.2% (Australia 35.2%)
Employed in manufacturing and construction: 20.9% (Australia 22.9%)
Paying a mortgage: 31.7% (Australia 34.5%)
Renting: 35.4% (Australia 30.9%)
Traditional families: 27.2% (Australia 32.8%)
Back to main page
|
|