|
|
|
|
| Adam Carr's Election Archive
|
Australian federal election, 2022
Division of Hotham, Victoria
Named for: Sir Charles Hotham (1806-55), Governor of
Victoria 1854-55 (Sir Charles pronounced his name Hutham, but the seat
has always been pronounced Hotham.)
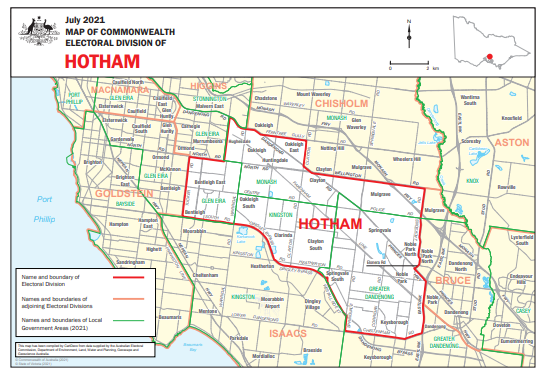
South-eastern Melbourne: Bentleigh, Clayton, Noble Park, Oakleigh, Springvale
State seats: Parts of
Bentleigh,
Clarinda,
Dandenong,
Keysborough,
Mulgrave and
Oakleigh
Local government areas: Parts of
Glen Eira,
Greater Dandenong,
Kingston and
Monash
Borders with:
Bruce,
Chisholm,
Goldstein,
Higgins and
Isaacs
Enrolment at 2019 election: 107,859
Enrolment at 2022 election: 116,085 (+07.6)
1999 republic referendum: Yes 54.2
2018 same-sex marriage survey: Yes 59.6
Sitting member: Clare O'Neil (Labor):
Elected 2013, 2016, 2019
2007 Labor majority over Liberal: 13.0%
2010 Labor majority over Liberal: 13.5%
2013 Labor majority over Liberal: 7.3%
2016 Labor majority over Liberal: 7.5%
2019 Labor majority over Liberal: 5.9%
2019 notional Labor majority over Liberal: 11.2%
Liberal two-party vote 1983-2019
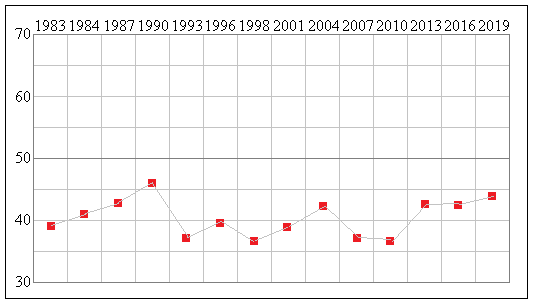
Status: Fairly safe Labor
Best Labor booths, two-party vote: Spring Valley (76.8), Heatherhill (76.6), Springvale South (74.4),
Noble Park (73.9), Southvale (73.5)
Best Liberal booths, two-party vote: Mulgrave PPVC (54.4), Bentleigh Central (49.3), McKinnon East (47.9),
Moorabbin South (46.4), Bentleigh East (46.1)
2019 results
Statistics and history
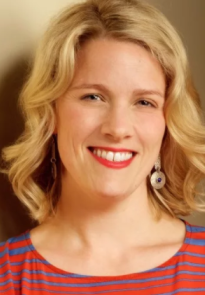
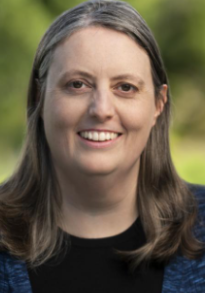
Candidates in ballot-paper order:
 |
 |
 |
 |
1. Edward Sok
Liberal Democrats |
2. Clare O'Neil
Australian Labor Party |
3. Dr Louisa Willoughby
Australian Greens |
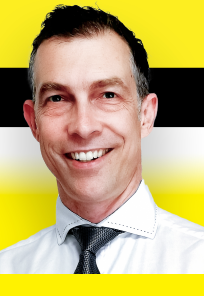
4. Bruce Ridgway
United Australia Party |
 |
 |
5. Roger Tull
Pauline Hanson's One Nation |
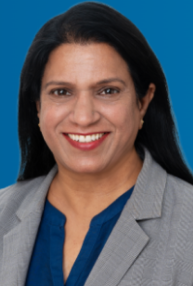
6. Dr Savitri Bevinakoppa
Liberal Party |
Candidate websites:
Dr Savitri Bevinakoppa
Clare O'Neil
Bruce Ridgway
Edward Sok
Dr Louisa Willoughby
Division of Hotham
Hotham was created in 1969, when the old seat of
, which had existed since 1949, was renamed (to avoid
confusion with a state seat of the same name). Over successive redistributions it has been shifted around the
south-eastern suburbs, moving from the Moorabbin-Sandringham area towards Clayton and Springvale. In the process
 it took in some of Melbourne's most heavily working-class and multicultural newer suburbs, while shedding older
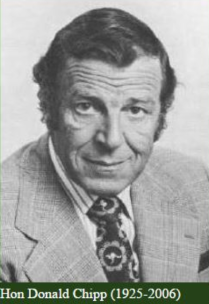
middle-class areas, and moved from fairly safe Liberal to safe Labor. In the 1960s Hotham was held by
Don Chipp, a minister
in Liberal governments and later founder and leader of the Australian Democrats.
Simon Crean won Hotham for Labor in 1990. He was President of the ACTU from 1985 to 1990, and was put
into the Hawke ministry as soon as he was elected in 1990, then promoted to Cabinet in 1991. He was an unsuccessful
Opposition Leader in 2001-03, but his career revived as a senior minister in the Rudd-Gillard Government. In 2013 he
resigned after his involvement in the botched first coup attempt against
Julia Gillard, and retired in 2013.
Clare O’Neil, Labor MP for Hotham since 2013, has a master's degree from Harvard and was a manager with McKinsey,
and mayor of the City of Greater Dandenong, before her election. She is now Shadow Minister for Senior Australians and
Aged Care Services.
The 2021 redistribution has extended Hotham further east, taking in Labor-voting Keysborough, Noble Park and
Springvale from Bruce. At the same time Hotham has lost Liberal-inclined Mount Waverley and Wheelers Hill to Chisholm.
These changes have substantially increased the Labor majority. The Liberal candidate is Dr Savitri Bevinakoppa,
a professor of engineering at Melbourne Institute of Technology. The Greens candidate is Dr Louisa Willoughby, Associate
Professor of Linguistics at Monash University.
Demographics:
Median weekly household income: $1,435 (Australia $1,438)
People over 65: 16.4% (Australia 15.8%)
Australian born: 51.9% (Australia 66.7%)
Ancestry: Chinese 9.2%, Greek 6.0%
Non-English-speaking households: 46.9% (Australia 22.2%)
Catholics 22.6% (Australia 22.6%)
Buddhist 9.2%
No religion 26.2% (Australia 29.6%)
University graduates: 25.4% (Australia 22.0%)
Professional and managerial employment: 35.2% (Australia 35.2%)
Employed in manufacturing and construction: 23.8% (Australia 22.9%)
Paying a mortgage: 33.5% (Australia 34.5%)
Renting: 26.7% (Australia 30.9%)
Traditional families: 38.6% (Australia 32.8%)
Back to main page
|
|
 it took in some of Melbourne's most heavily working-class and multicultural newer suburbs, while shedding older
middle-class areas, and moved from fairly safe Liberal to safe Labor. In the 1960s Hotham was held by
Don Chipp, a minister
in Liberal governments and later founder and leader of the Australian Democrats.
