|
|
|
|
| Adam Carr's Election Archive
|
Australian federal election, 2022
Division of Franklin, Tasmania
Named for: Sir John Franklin (1786-1847), Lt Governor of Tasmania
1843-46 and polar explorer
Eastern and southern Hobart: Huonville, Kingston, Lindisfarne, Margate, Warrane
State seats: All of
Franklin
Local government areas: All of
Huon Valley, parts of
Clarence and
Kingborough
Borders with:
Braddon,
Clark and
Lyons
Enrolment at 2019 election: 76,673
Enrolment at 2022 election: 80,331 (+04.8)
1999 republic referendum: No 53.8
2018 same-sex marriage survey: Yes 68.8
Sitting member: Hon Julie Collins (Labor):
Elected 2007, 2010, 2013, 2016, 2019
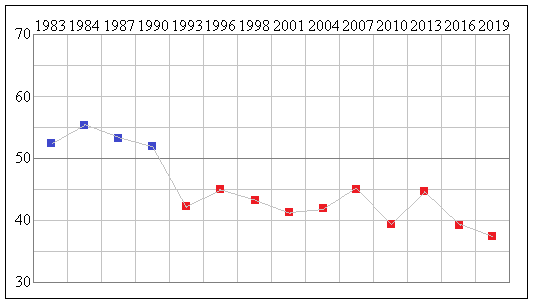
2007 Labor majority over Liberal: 4.5%
2010 Labor majority over Liberal: 10.8%
2013 Labor majority over Liberal: 5.1%
2016 Labor majority over Liberal: 10.7%
2019 Labor majority over Liberal: 12.2%
Liberal two-party vote 1983-2019
Status: Safe Labor
Best Labor booths, two-party vote: Clarendon Vale (76.7), Risdon Vale (76.5), Rokeby (75.0),
Warrane (74.6), Mornington (70.1)
Best Liberal booths, two-party vote: Cambridge (45.1), Dover (44.0), Sandfly (43.9), Geeveston (43.8),
Tranmere (43.8)
2019 results
Statistics and history
Candidates in ballot-paper order:
 |
 |
 |
 |
 |
1. Anna Bateman
Local Party |
2. Hon Julie Collins
Australian Labor Party |
3. Duane Pitt
Liberal Democrats |
4. Stephen Hindley
Pauline Hanson's One Nation |
5. Lisa Matthews
United Australia Party |
 |
 |
 |
 |
6. Chris Hannan
Jacqui Lambie Network |
7. Kristy Johnson
Liberal Party |
8. Katrina Love
Animal Justice Party |
9. Jade Darko
Australian Greens |
Candidate websites:
Anna Bateman
Hon Julie Collins
Jade Darko
Chris Hannan
Kristy Johnson
Katrina Love
Lisa Matthews
Duane Pitt
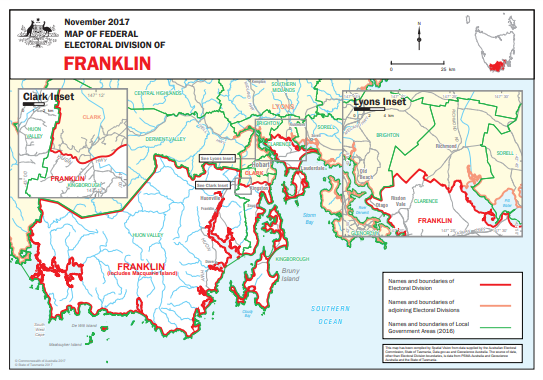
Division of Franklin
Franklin has existed since Tasmania was first divided into electorates in 1903, initially taking in much of
southern and central Tasmania. In recent times it has been cut back to become a Hobart suburban seat, covering
the suburbs on the eastern shore of the Derwent River, but also taking in some outer suburban territory to the
south-west of Hobart, plus the thinly inhabited south-west corner of the state. Like all the Tasmanian seats it has
a relatively low median family income level, and a very low proportion of non English speaking
households. As a suburban seat it has a fairly high proportion of families with dependent children and dwellings
being purchased.
Over the decades Franklin has been held by both sides of politics for extended periods, but it's now more than 30
years since it was won by the Liberals. Even in 2013 Labor won nearly all of the eastern shore booths, some by
wide margins, while the Liberals were confined to a few high-income areas like Tranmere.
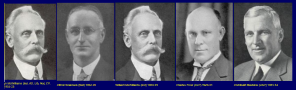
Harry Quick won Franklin for Labor in 1993. Quick and his Liberal predecessor
Bruce Goodluck were both colourful
personalities who held the seat largely on their personal standing in the rather parochial atmosphere of
Tasmanian politics. Quick retired in 2007 and the seat was retained by Labor's Julie Collins. Labor retained it
fairly easily even in 2013, when the Liberals swept away Labor members in
Bass,
Braddon and
Lyons, and again in 2019
in the face of another statewide swing to the Liberals.
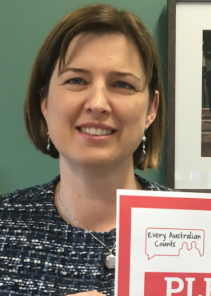
Julie Collins, Labor MP for Franklin since 2007, was a public servant, ministerial adviser (including to Tasmanian
Premier
Jim Bacon) and state secretary of the Tasmanian Labor Party before her election.
She became a parliamentary
secretary in 2010 and Minister for Community Services in 2011. She is now Shadow Minister for Agriculture. The Liberal
candidate is Kristy Johnson, a small business owner - not to be confused with the state MP Kristie Johnston. The Greens
candidate is Jade Darko, a programmer.
Demographics:
Median weekly household income: $1,265 (Australia $1,438)
People over 65: 19.3% (Australia 15.8%)
Indigenous: 4.5% (Australia 2.8%)
Australian born: 81.7% (Australia 66.7%)
Non-English-speaking households: 6.3% (Australia 22.2%)
Catholics 17.0% (Australia 22.6%)
No religion 39.4% (Australia 29.6%)
University graduates: 19.5% (Australia 22.0%)
Professional and managerial employment: 33.5% (Australia 35.2%)
Employed in manufacturing and construction: 23.3% (Australia 22.9%)
Employed in agriculture: 5.8% (Australia 3.3%)
Paying a mortgage: 38.2% (Australia 34.5%)
Renting: 21.4% (Australia 30.9%)
Traditional families: 29.2% (Australia 32.8%)
Back to main page
| |