|
|
|
|
| Adam Carr's Election Archive
|
Australian federal election, 2022
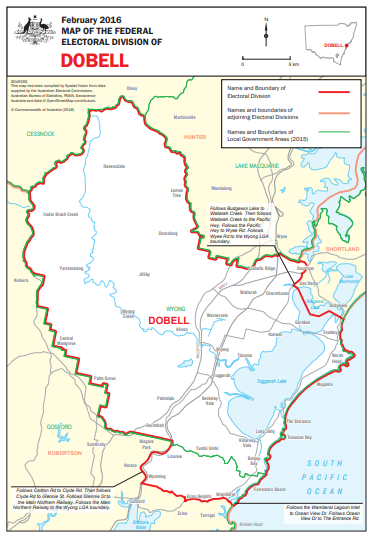
Division of Dobell, New South Wales
Named for: Sir William Dobell (1899-1970), painter
New South Wales Central Coast: Bateau Bay, Kanwal, The Entrance, Toukley, Wyong
State seats: All of
Wyong, parts of
Terrigal and
The Entrance
Local government areas: Parts of Central Coast
Borders with:
Hunter,
Robertson and
Shortland
Enrolment at 2019 election: 117,359
Enrolment at 2022 election: 118,581 (+01.1)
1999 republic referendum: No 57.5
2018 same-sex marriage survey: Yes 65.7
Sitting member: Emma McBride (Labor):
Elected 2016, 2019
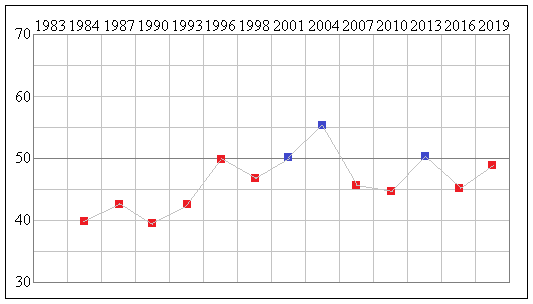
2007 Labor majority over Liberal: 3.9%
2010 Labor majority over Liberal: 5.1%
2013 Liberal majority over Labor: 0.7%
2016 Labor majority over Liberal: 4.8%
2019 Labor majority over Liberal: 1.5%
Liberal two-party vote 1983-2019
Status: Very marginal Labor
Best Labor booths, two-party vote: Watanobbi (62.8), Blue Haven (61.2), Gorokan (59.0),
Kanwal (58.8), Charmhaven (58.7)
Best Liberal booths, two-party vote: Kulnura (70.6), Erina Heights (62.4), Forresters Beach (62.6),
Wamberal (59.1), Holgate (56.7)
2019 results
Statistics and history
Candidates in ballot-paper order:
 |
 |
 |
 |
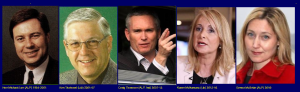
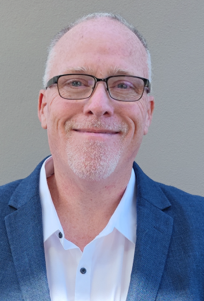
1. Geoff Barnes
Fusion Party |
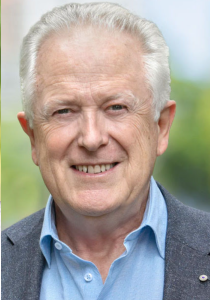
2. Dean Mackin
United Australia Party |
3. Dr Michael Feneley AM
Liberal Party |
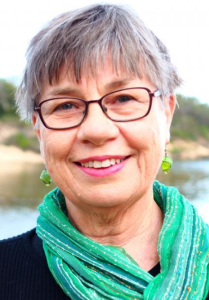
4. Cath Connor
Australian Greens |
 |
 |
 |
5. Martin Stevenson
Pauline Hanson's One Nation |
6. Eliot Metherell
Liberal Democrats |
7. Emma McBride
Australian Labor Party |
Candidate websites:
Geoff Barnes
Cath Connor
Dr Michael Feneley AM
Emma McBride
Dean Mackin
Eliot Metherell
Scott Rickard
Martin Stevenson
Division of Dobell
Dobell was created in 1984, carved out of the seats of
Robertson and
Shortland. It is a mix of Sydney
exurbia and tourism and retirement centres such as Bateau Bay. It has a high proportion of over-65s,
and a low proportion of people in non English speaking households and of people in professional and managerial
occupations.
Dobell was a fairly safe seat for the rising Labor star
Michael Lee until 1996, when he very nearly
lost it in that year's Howard landslide. He recovered in 1998, but in 2001 he was unexpectedly beaten
by the Liberals'
Ken Ticehurst. Labor regained the seat in 2007, but soon wished they had not, since the
new Labor member,
Craig Thomson, proved a severe embarrassment.
During 2010 it emerged that Thomson had stolen large amounts of money from his former employer, the
Health Services Union, with the connivance of other officials, and had spent the money on, among other
things, prostitutes. Thomson denied the charges, but resigned from the Labor Party and contested Dobell
as an independent in 2013, polling 4% of the vote. In 2014 he was convicted of theft.
His Liberal successor,
Karen McNamara, had a margin of only 0.7%, and this was wiped out by the 2016
redistribution, which moved Liberal-voting Terrigal to Robertson, while adding Labor-voting Goroke and
Lake Haven. This was enough to hand the seat back to Labor in 2016.
Emma McBride, Labor MP for Dobell since 2016, was Deputy Director of Pharmacy for the Central Coast
Local Health District and a Wyong Shire councillor before her election. She survived a swing to the Liberals in 2019,
but will be in serious danger if there is any further decline in Labor's support in NSW. The Liberal candidate is
Dr Michael Feneley AM, a cardiologist. The Greens candidate is Cath Connor, a social worker.
Demographics:
Median weekly household income: $1,268 (Australia $1,438)
People over 65: 19.6% (Australia 15.8%)
Indigenous: 4.4% (Australia 2.8%)
Australian born: 80.2% (Australia 66.7%)
Non-English-speaking households: 7.8% (Australia 22.2%)
Catholics 25.3% (Australia 22.6%)
No religion 26.8% (Australia 29.6%)
University graduates: 11.8% (Australia 22.0%)
Professional and managerial employment: 27.3% (Australia 35.2%)
Employed in manufacturing and construction: 29.6% (Australia 22.9%)
Paying a mortgage: 35.0% (Australia 34.5%)
Renting: 28.0% (Australia 30.9%)
Traditional families: 31.3% (Australia 32.8%)
Back to main page
| |