|
|
|
|
| Adam Carr's Election Archive
|
Australian federal election, 2022
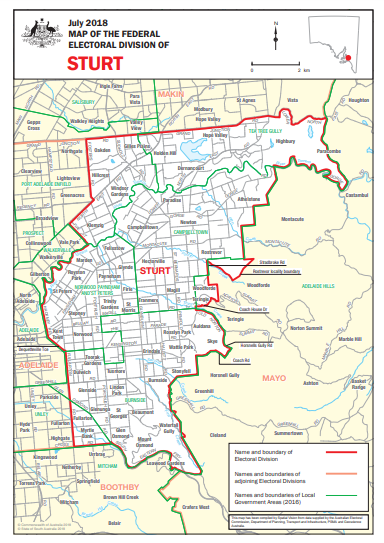
Division of Sturt, South Australia
Named for: Charles Sturt (1795-1869), explorer of the Murray River
Eastern Adelaide: Glenunga, Highbury, Norwood, Rostrevor, Windsor Gardens
State seats: All of
Dunstan and
Hartley, parts of
Bragg,
Morialta and
Torrens
Local government areas: All of
Burnside and
Campbelltown, parts of
Adelaide Hills,
Norwood Payneham and St Peters,
Port Adelaide-Enfield,
Tea Tree Gully and
Unley
Borders with:
Adelaide,
Boothby,
Makin and
Mayo
Enrolment at 2019 election: 123,833
Enrolment at 2022 election: 129,151 (+04.3)
1999 republic referendum: Yes 53.7
2018 same-sex marriage survey: Yes 61.6
Sitting member: James Stevens (Liberal):
Elected 2019
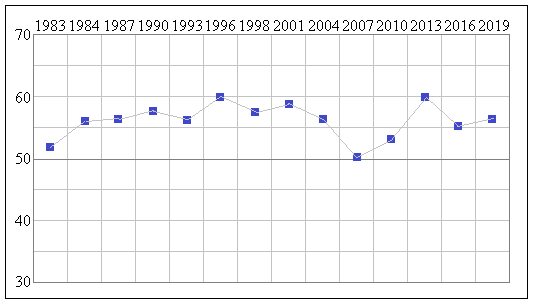
2007 Liberal majority over Labor: 0.9%
2010 Liberal majority over Labor: 3.4%
2013 Liberal majority over Labor: 10.1%
2016 Liberal majority over Labor: 5.9%
2019 Liberal majority over Labor: 6.9%
Liberal two-party vote 1983-2019
Status: Marginal Liberal
Best Liberal booths, two-party vote: Myrtle Bank PPVC (70.2), Beaumont (68.4), Kensington Gardens (67.2), Tusmore (66.9),
Linden Park (66.1)
Best Labor booths, two-party vote: Gillies Plains (57.3), Hillcrest (53.6), Holden Hill (53.2), Felixstowe (53.0),
Windsor Gardens West (52.9)
2019 results
Statistics and history
Candidates in ballot-paper order:
 |
 |
 |
 |
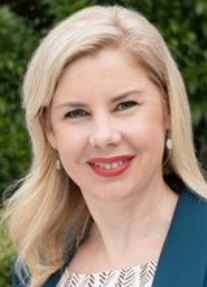
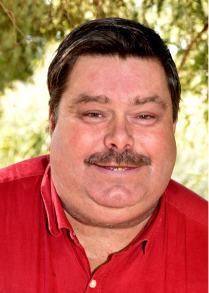
1. Katie McCusker
Australian Greens |
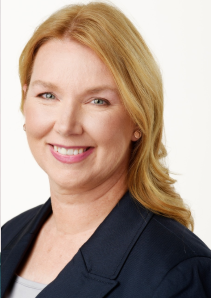
2. Sonja Baram
Australian Labor Party |
3. Chris Schmidt
The New Liberals |
4. Alexander Allwood
Pauline Hanson's One Nation |
 |
 |
 |
 |
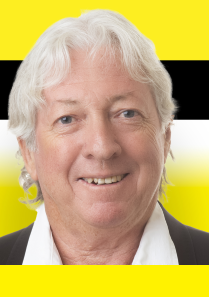
5. Angela Fulco
Australian Progressives |
6. Stephen Grant
United Australia Party |
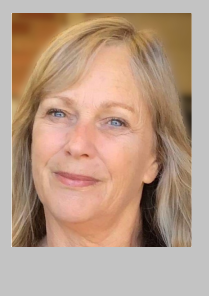
7. Kathy Scarborough
Australian Federation Party |
8. David Sherlock
Animal Justice Party |
 |
 |
 |
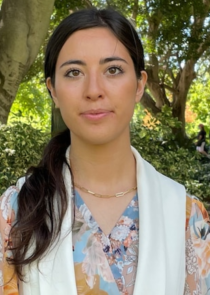
9. Thomas McMahon
Liberal Democrats |
10. Inti Elham
Drew Pavlou Democratic Alliance |
11. James Stevens
Liberal Party |
Candidate websites:
Sonja Baram
Inti Elham
Angela Fulco
Stephen Grant
Katie McCusker
Thomas McMahon
Kathy Scarborough
David Sherlock
Chris Schmidt
James Stevens
Division of Sturt
Sturt was created in 1949, and has always occupied a block of territory in Adelaide's eastern suburbs, between
the city and the hills. It includes some very wealthy areas in the south and in the fringes of the Adelaide Hills,
but is mostly middle-class suburbia. There are a few Labor-voting areas in the north of the seat. Sturt combines a
fairly high median family income level, a fairly high proportion of people in non English speaking households
and a fairly high proportion of people in professional occupations.
This is usually a dangerous combination for a Liberal member. But although Sturt has usually been a marginal seat,
Labor has only won it twice, in 1954 and 1969. The 2018 redistribution added some marginal territory around Norwood and
St Peters, slightly reducing the Liberal majority.
Christopher Pyne was a 25-year-old solicitor and Liberal staffer when he succeeded the veteran former minister
Ian Wilson
in 1993. He was a junior minister in the last term of the Howard government. He was very nearly defeated at the 2007 election, but
suvived and was a Cabinet minister throughout the Abbott-Turnbull-Morrison government, finally as Defence Minister under
Scott Morrison. In March 2019 he announced that he
would not stand again at the May election.
James Stevens, Liberal MP for Sturt since 2919, was chief of staff to SA Premier
Steven Marshall, and Pyne's
campaign manager and preferred successor. He retained Sturt without difficulty in 2019 despite the loss of Pyne's
personal vote. The Labor candidate is Sonja Baram, a family therapist. The Greens candidate is Katie McCusker, who is the SA Greens state co-convenor and office manager.
Demographics:
Median weekly household income: $1,328 (Australia $1,438)
People over 65: 20.9% (Australia 15.8%)
Australian born: 63.5% (Australia 66.7%)
Ancestry: Italian 12.2%, Chinese 6.4%
Non-English-speaking households: 31.8% (Australia 22.2%)
Catholics 25.9% (Australia 22.6%)
No religion 30.2% (Australia 29.6%)
University graduates: 30.2% (Australia 22.0%)
Professional and managerial employment: 41.8% (Australia 35.2%)
Employed in manufacturing and construction: 19.8% (Australia 22.9%)
Paying a mortgage: 32.1% (Australia 34.5%)
Renting: 26.8% (Australia 30.9%)
Traditional families: 31.9% (Australia 32.8%)
Back to main page
|
|

