|
|
|
|
| Adam Carr's Election Archive
|
Australian federal election, 2022
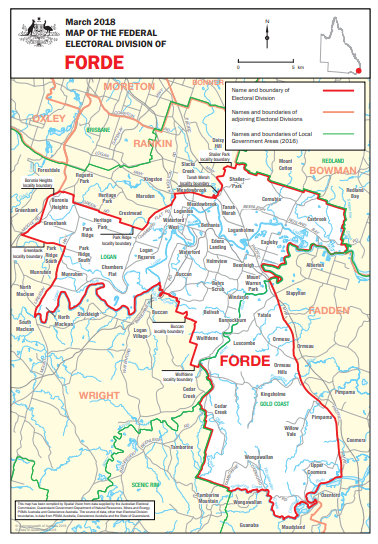
Division of Forde, Queensland
Named for: Rt Hon Frank Forde (1890-1983), Qld MP 1917-22, federal MP
1922-46, Prime Minister 1945, Qld MP 1955-57
South of Brisbane: Beenleigh, Boronia Heights, Loganholme, Shailer Park, Upper Coomera
State seats: All of
Macalister, parts of
Coomera,
Logan,
Springwood,
Theodore,
Waterford and
Woodridge
Local government areas: Parts of
Gold Coast and
Logan
Borders with:
Bowman,
Fadden,
Rankin and
Wright
Enrolment at 2019 election: 107,272
Enrolment at 2022 election: 119,198 (+11.1)
1999 republic referendum: No 68.7
2018 same-sex marriage survey: Yes 60.5
Sitting member: Bert van Manen (Liberal):
Elected 2010, 2013, 2016, 2019
2007 Labor majority over Liberal: 2.9%
2010 Liberal majority over Labor: 1.6%
2013 Liberal majority over Labor: 4.4%
2016 Liberal majority over Labor: 0.6%
2019 Liberal majority over Labor: 8.6%
Liberal two-party vote 1983-2019

Status: Fairly safe Liberal
Best Liberal booths, two-party vote: Carbrook (70.5), Oxenford (66.8), Springwood PPVC (66.7),
Canowindra (65.6), Northern Gold Coast PPVC (65.1)
Best Labor booths, two-party vote: Loganlea (57.9), Meadowbrook (56.0), Eagleby South (53.7),
Marsden (53.7), Boronia Heights (52.6)
2019 results
Statistics and history
Candidates in ballot-paper order:
 |
 |
 |
 |
 |
1. Roxanne O'Halloran
United Australia Party |
2. Bert van Manen
Liberal Party |
3. Jordan Hall
Australian Greens |
4. Samuel Holland
The New Liberals |
5. Rowan Holzberger
Australian Labor Party |
 |
 |
 |
 |
6. Seschelle Matterson
Pauline Hanson's One Nation |
7. Tobby Sutherland
Liberal Democrats |
8. Chris Greaves
Independent |
9. Linda McCarthy
Animal Justice Party |
Candidate websites:
Chris Greaves
Jordan Hall
Samuel Holland
Rowan Holzberger
Linda McCarthy
Seschelle Matterson
Roxanne O'Halloran
Tobby Sutherland
Bert van Manen
Division of Forde
Forde was created in 1984, and was originally located in the southern suburbs of Brisbane. Successive
redistributions have pushed it southwards, and it now has none of its original territory.
On its current boundaries, it is based on outer suburbs such as Shailer Park and Waterford, the satellite town of
Beenleigh and some parts of the Gold Coast hinterland. It was not significantly altered by the 2018
redistribution.
The suburban parts of Forde are mortgage belt territory, with high levels of families with dependent children
and of dwellings being purchased, and with the usual low level of people in professional occupations. Labor has some
strong areas in Beenleigh and along the northern edge of the seat in Loganlea and Marsden, while the Liberals dominate
the semi-rural areas to the south.
Forde has not been a safe seat for any of its five previous members.
Kay Elson held it for the Liberals during
the 11 years of the Howard government before retiring in 2007. She was succeeded by
Brett Raguse, who gained a very
big swing. In 2010, the sharp swing against Labor that followed the demise of
Kevin Rudd saw Raguse defeated by
Bert van Manen. Van Manen was comfortably re-elected in 2013, despite Labor running former Premier
Peter Beattie
as its candidate, but only narrowly re-elected in 2016. In 2019 he scored a big swing and the seat is now classed as
fairly safe for the Liberals.
Bert van Manen, Liberal MP for Forde since 2010, was a bank officer and financial adviser before being
elected. He has been an inconspicuous backbencher in Canberra. The Labor candidate is Rowan Holzberger, whose
occuation is not stated. The Greens candidate is Jordan Hall, a teacher.
Demographics:
Median weekly household income: $1,463 (Australia $1,438)
People over 65: 12.7% (Australia 15.8%)
Indigenous: 2.8% (Australia 2.8%)
Australian born: 67.6% (Australia 66.7%)
Non-English-speaking households: 13.9% (Australia 22.2%)
Catholics 18.9% (Australia 22.6%)
No religion 31.2% (Australia 29.6%)
University graduates: 11.5% (Australia 22.0%)
Professional and managerial employment: 23.7% (Australia 35.2%)
Employed in manufacturing and construction: 34.4% (Australia 22.9%)
Paying a mortgage: 39.5% (Australia 34.5%)
Renting: 34.5% (Australia 30.9%)
Traditional families: 37.9% (Australia 32.8%)
Back to main page
| |